
Dr. Isaac O. Ajao 2026-10-11
On Saturday, 10 October 2026, the Ekiti R-Users Group held a live session on YouTube: From Spreadsheet to Script: A Practical Introduction to RII Analysis in R. If you missed it, or want to go over it again, this post has the recording and all the code in one place.
📺 Watch the recording: https://www.youtube.com/watch?v=ZezD-5crlzs
Why move RII out of Excel?
The Relative Importance Index is the standard way to rank factors that respondents rate on a Likert scale — causes of building collapse, barriers to technology adoption, factors affecting cost overruns, and so on:
where is each respondent’s weight (score), is the highest point on the scale and is the number of respondents. Every item gets a score between 0 and 1, and the items are ranked from most to least important.
Most researchers compute this in Excel, with one SUMPRODUCT formula per row copied down a column. It works, but it is slow, and it is easy for a formula to end up pointing at the wrong row after you sort. The RII package does the whole calculation — mean, standard deviation, RII, rank and importance band — in one function call.
Install the package
install.packages("remotes")
remotes::install_github("softdataconsult/RII")
A worked example
The package comes with a dataset of 150 Nigerian construction professionals who rated 10 perceived causes of building collapse on a 5-point scale. Columns 5 to 14 hold the Likert items.
library(RII)

data(building_collapse_nigeria)

items <- building_collapse_nigeria[, 5:14]
tbl <- rii_table(items)
tbl
Relative Importance Index table (scale 1-5)
----------------------------------------
Item N Mean SD RII Rank Band
SubstandardMaterials 150 4.720 0.569 0.944 1 High
NonComplianceBuildingCode 150 4.647 0.657 0.929 2 High
PoorWorkmanship 150 4.633 0.727 0.927 3 High
PoorSupervision 150 4.607 0.713 0.921 4 High
UnqualifiedArtisans 150 4.493 0.841 0.899 5 High
CorruptionApprovalProcess 150 4.480 0.865 0.896 6 High
StructuralDesignErrors 150 4.140 1.232 0.828 7 High
InadequateSoilInvestigation 150 4.027 1.152 0.805 8 High
Overloading 150 3.727 1.263 0.745 9 High-Medium
LackOfMaintenance 150 3.353 1.391 0.671 10 High-MediumThat one line replaces ten Excel formulas. The table is already ranked, and each item is placed in the standard importance band used in the literature (High, High-Medium, Medium, Medium-Low, Low).
For a quick overview — the top item, the range of RII values and how many items fall in each band:
summary(tbl)Items ranked : 10
Top-ranked item : SubstandardMaterials (RII = 0.944)
RII range : 0.671 to 0.944
Mean RII across items : 0.857
Items per importance band:
High High-Medium Medium Medium-Low Low
8 2 0 0 0 And a ranked bar chart, ready for a thesis or paper:
plot(tbl)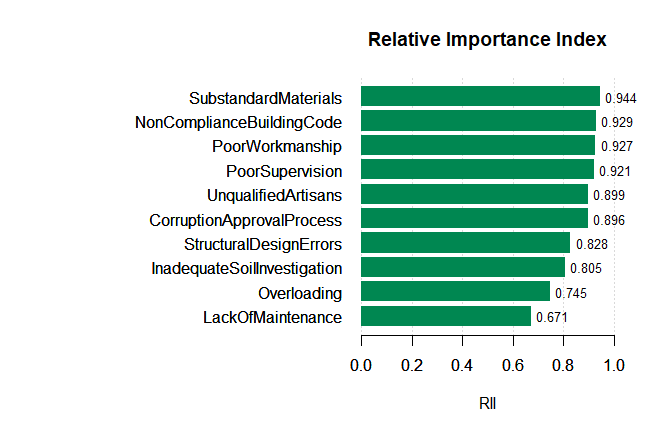
Real survey data is messy
Survey exports rarely look as tidy as the example above. Three problems came up again and again during the session, and the package handles each one.
Demographic columns mixed in with the items. A gender column coded 1 and 2 looks just like a Likert item. Instead of typing out every item column, let the package detect them, and it will tell you what it included and excluded:
rii_table(my_survey, items = "auto")Text labels instead of numbers. Google Forms exports give you “Strongly Agree”, “Disagree” and so on. Convert them first:
d2 <- recode_likert(my_survey)
rii_table(d2, items = "auto")
Several sections in one questionnaire. Rank each section on its own by giving a column range:
road_quality <- rii_table(d, items = 4:10)    # Section 1
maintenance  <- rii_table(d, items = 11:13)   # Section 2
Not every scale is 1 to 5
RII works on any scale. The second bundled dataset has 175 farmers rating barriers to climate-smart agriculture adoption on a 4-point scale:
data(csa_adoption_barriers_nigeria)

barriers <- csa_adoption_barriers_nigeria[, 6:15]
rii_table(barriers, scale_max = 4)
Relative Importance Index table (scale 1-4)
----------------------------------------
Item N Mean SD RII Rank Band
HighCostOfImprovedInputs 175 3.651 0.642 0.913 1 High
LackOfAccessToCredit 175 3.520 0.808 0.880 2 High
LimitedExtensionServices 175 3.520 0.787 0.880 3 High
UnpredictableWeatherPatterns 175 3.383 0.814 0.846 4 High
LackOfGovernmentSupport 175 3.303 0.913 0.826 5 High
InadequateIrrigationInfra 175 3.246 0.948 0.811 6 High
LackOfTechnicalKnowledge 175 3.240 0.941 0.810 7 High
LandTenureInsecurity 175 3.017 1.058 0.754 8 High-Medium
LackOfMarketAccess 175 2.989 1.109 0.747 9 High-Medium
LowLiteracyLevels 175 2.377 1.020 0.594 10 MediumYou can also set scale_min for 0-based scales, and reverse-score negatively worded items with reverse_items.
Reading from, and writing to, Excel
You don’t have to leave your spreadsheet behind completely. Read it in directly, and hand the results back as a colour-coded Excel report with the chart included:
d   <- read_rii_excel("survey.xlsx", layout = "raw", items = "auto")
tbl <- rii_table(d)
write_rii_excel(tbl, "rii_results.xlsx")
CSV (read_rii_csv()) and SPSS .sav files (read_rii_spss()) work the same way. If your spreadsheet only has frequency counts per scale point rather than individual responses, use rii_table_freq().
Practice datasets
These are the datasets, code and slides used in the live session:
Try them yourself before checking the recording.
Using RII in your research
If the package helps your work, please cite it:
citation("RII")Ajao I (2026). RII: Relative Importance Index for Likert-Scale Survey Data. R package version 0.1.0, https://github.com/softdataconsult/RII.
The package is new, so feedback is very welcome. Report bugs or request features on GitHub Issues, or email softdataconsult@gmail.com.
Want to learn R for your own research? Join the Ekiti R-Users Group on Meetup, subscribe on YouTube, or see our training courses.